Tracking Algorithm
In order to monitor a 3d printer successfully, we must combine the AI score outputs with a tracking algorithm to ensure that a single strong detection does not trigger an action. In order to do this, we take the output of the AI model at every time interval and use an algorithm to track it over N intervals and then determine if any action should be taken.
Exponentially Moving Average
The main tracking algorithm we use is an Exponentially-Moving-Average (EMA) that puts more emphasis on the pervious detections than the current. The equation for the EMA is as follows:
The value N = Number of Time Periods is set in the AI software as the buffer_length, which is now hidden from the user. Currently, four presets are given for the user using the Sensitiviy setting:
Sensitivity : this is the current sensitivity of the AI set by the user. It can be three values:
Ultra-Fast (1 minutes): it takes ~1 minutes of consistent positive detections for an action to occur. A buffer length ofN = 8is used.Fast (3 minutes): it takes ~3 minutes of consistent positive detections for an action to occur. A buffer length ofN = 16is used.Medium (6 minutes): it takes ~6 minutes of consistent positive detections for an action to occur. A buffer length ofN = 32is used.Long (12 minutes): it takes ~12 minutes of consistent positive detections for an action to occur. A buffer length ofN = 64is used.
In addition to using the EMA, a set of rules are used in order to determine when to send a notification or action. The current rule is that the EMA value must be greater than the notification threshold or the action threshold for N = 0.5 * buffer_length cycles for that action to take place.
With this rule, that means that the EMA score must stay at or above the given threshold value for the following amount of cycles based on which Sensitivity is used:
Sensitivity :
Ultra-Fast (1 minutes): 4 cyclesFast (3 minutes): 8 cyclesMedium (6 minutes): 16 cyclesLong (12 minutes): 32 cycles
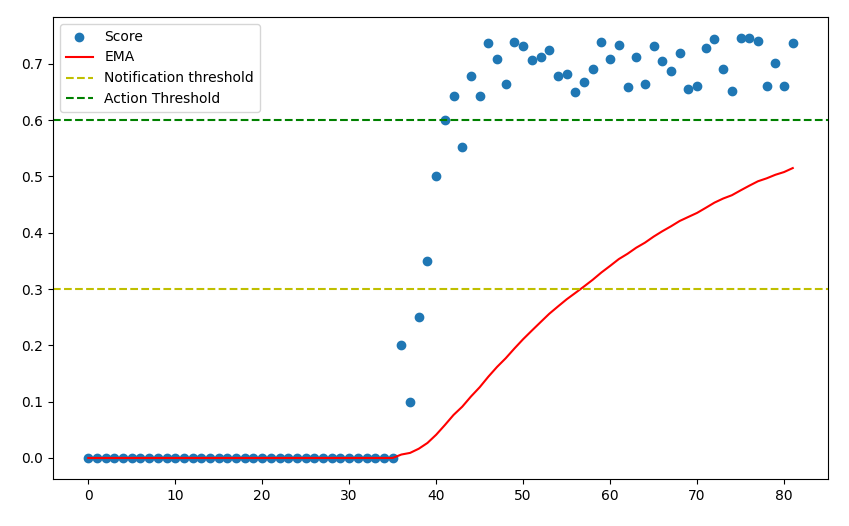
Visualization
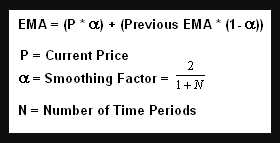
To help visualize the detection scores, EMA, thresholds, and when an action occurs, the following plots have been created for the same detection scenario based on the Sensitivity for 16 minutes of data:
Ultra-Fast:
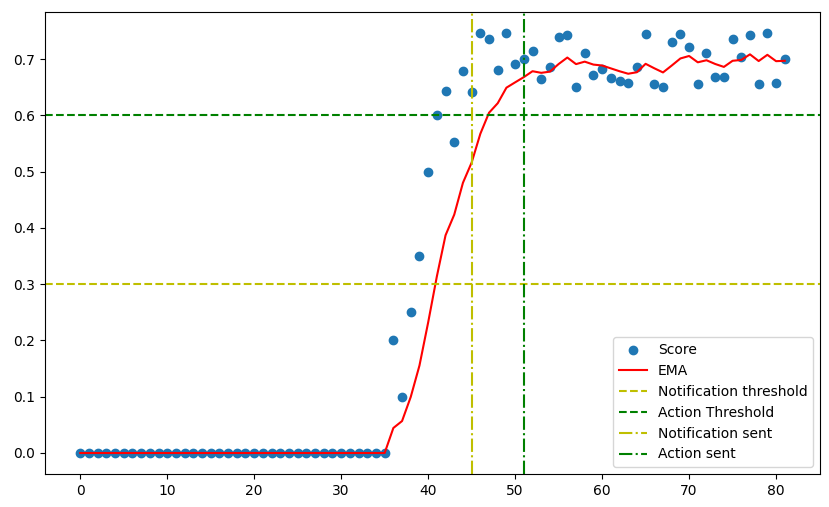
Fast:
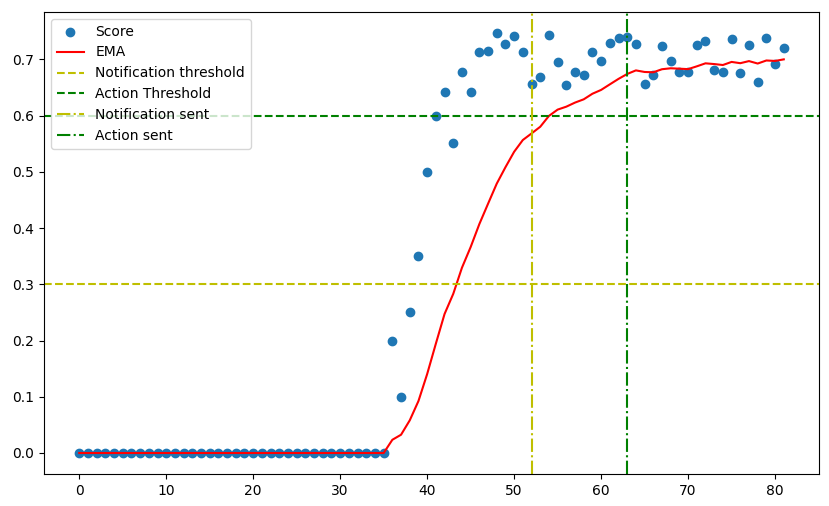
Medium:
Long:
Long requires more cycles for an action to occur.
Visualize the results for yourself with the Python Script located in ./tools/buffer_length.py